
The first measure of email marketing success is deliverability. You need proper strategies to ensure your emails land in subscribers’ inboxes. To create a data-driven approach, you must be well aware of relevant stats.
Here, we have created this blog to help you with all the necessary email deliverability statistics to check right now. If you want to develop a dynamic email deliverability strategy, the following stats would be immensely enlightening.
Why Do You Need Email Deliverability Statistics

Email deliverability is the state of your emails delivered to the recipients’ inboxes. When you send email campaigns to your subscribers, it’s the email deliverability that hold up the possibilities of further success.
Ensured a high deliverability means your subscribers get the message, and the next step is getting them open, and then click on the link or complete an email conversion. Email delivery is the centre of your overall email sending process.
So, when you are up to develop a successful email marketing process for your brand, you must understand how every aspects of email delivery work. And, the best way to do that is take a closer look at the email deliverability statistics in the first place.
Email Deliverability Statistics for Marketing Email
1. The average email deliverability rate in 2024 across multiple top email marketing platforms is 83% (EmailToolTester)
2. More than 10% of emails ended up in subscribers’ spam folders. (EmailTooltester)
3. Approximately, 1 in 6 marketing emails never reach the subscribers. (EmailTooltester)
4. 20% of emails fail to reach recipients inbox. (Returnpath)
5. A 95% or higher delivery rate is considered excellent. (Omnisend)
6. The industry-accepted benchmark for email bounce rate is 2%. (MyEmma)
7. Based on the respective engagement levels, 63% of businesses adjust the frequency of emails sent to subscribers. (Databox)
8. Spam complaints are the second most common reason for inbox placement issues, accounting for 21%. (ReturnPath)
🧠 Also Read: Best Email Spam Checker Tools to Ensure a High Deliverability
9. The main reason for a low inbox placement rate is low mailbox usage, contributing to 19% of such issues. (ReturnPath).
10. In September 2020, spam emails constituted 47.3% of total email traffic. (Statista)
11. Approximately 23% of an email list declined in quality each year. (ZeroBounce)
12. The worldwide inbox placement stood at 83% in 2019, whereas the spam placement rate was recorded at 7%. (Returnpath)
13. Marketing emails generally exhibit a low engagement rate, with an open rate of 20-25% (Source: Hubspot).
14. Email delivery rates have steadily increased over the last three years, the overall rate stood at 98.2% (DotDigital).
15. 17% of emails never reach your subscribers’ inboxes. (EmaillToolTester)
Email Open Rate Statistics
16. Global marketers across all industries reported that the average email open rate is 46-50% (Hubspot)
17. The average email open rate across the industry is 21% or above. (Mailmunch)
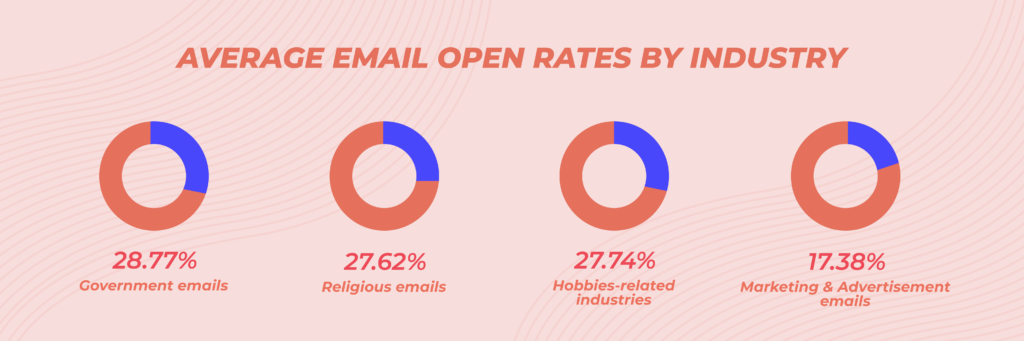
18. Govt emails have the highest open rate (28.77%). Hobbies-related industries like photography, writing, and sketching, have a 27.74% open rate. On the other hand, marketing and advertisement possess an open rate of 17.38%. (Mailmunch)
19. The average CTOR (click-to-open rate) is 10% or above. (Mailmunch)
20. The top industries that have the highest CTOR are Real Estate, Education, and Government & Politics. (Mailmunch)
Transactional Email Statistics and Deliverability
21. Transactional emails have an average of 40-50% open rate, where the click rate stands around 10-2%. (Innertrends)
22. The average click-through rate on transactional emails was 10% and 30% for top emailers. (bizibl)
23. Transactional emails like order confirmations, shipping notifications, and password resets emails generated usually 6x higher revenue than regular marketing emails. (CampaignMonitor)
Email Deliverability Across the ISPs
The following stats were collected from GlockApp and EmailToolTester users, and we’ve compiled them to let you know how most of the top ISPs (Internet Service Providers) are performing regarding email deliverability –
AOL average delivery rates
- Inbox: 38.3%
- Spam: 34.2%
- Undelivered: 27.5%
Yahoo average delivery rates:
- Inbox: 38.6%
- Spam: 34.8%
- Undelivered: 26.6%
Gmail average delivery rates:
- Inbox: 70.7%
- Spam: 14.8%
- Undelivered: 14.5%
Outlook average delivery rates:
- Inbox: 39.9%
- Spam: 34.7%
- Undelivered: 25.3%
Hotmail average delivery rates:
- Inbox: 40.6%
- Spam: 33.6%
- Undelivered: 25.8%
Email Platforms for Highest Email Delivery Rate
According to the aforementioned data and user insights, here are the top five email-sending platforms considering email delivery rate –
- Active Campaign (94.2%)
- Constant Contact (91.7%)
- GetResponse ((90.9%)
- Moosend (90.1%)
- CleverReach (90%)
Email Platforms for Lowest Email Delivery Rate
- Aweber (83.1%)
- Hubspot (77.7%)
- Omnisend (75.1%)
- Sendpulse (62.8%)
- Benchmark (47.1%)
Closing Ups
The stats we’ve mentioned in this blog are well-sourced. We have researched through top email marketing platforms, and statistical platforms to compile this.
We believe these data are enough to help you get the nature of real case of email open rate, bounce rate, click to open rate, and overall email deliverability.
If you have any contra to the aforementioned stats, let us know and we will be update the blog after further checking.